OpenTelemetry Auto-Instrumentation in Node.js (with NestJS and NX)
TL;DR
- How it works: OpenTelemetry auto-instrumentation uses monkey-patching to intercept module loading and wrap functions with tracing logic
- The catch: Instrumentation must initialize before target modules load, or the patches have nothing to hook into
- Bundlers complicate things: esbuild, webpack, and others can reorder module initialization, breaking the required loading sequence
- The fix: Use Node’s
--requireflag to load instrumentation outside the bundle’s module system
🔗 Example Repository on GitHub
What is OpenTelemetry?
OpenTelemetry (OTEL) is a vendor-neutral standard for collecting observability data (traces, metrics, and logs) from your applications. Instead of locking into a specific monitoring vendor’s SDK, you instrument your code once with OpenTelemetry and export the data to any compatible backend: Jaeger, Zipkin, Grafana Tempo, Datadog, or dozens of others.
For distributed systems like microservices, traces are particularly valuable. A single user request might touch five different services, and those services might even not communicate the same way with each other. One call might be HTTP, the next goes through RabbitMQ via AMQP, another hits a PostgreSQL database. A trace connects all of these into one coherent timeline, showing you exactly where time is spent and where failures occur.
Auto-instrumentation takes this a step further. Instead of manually adding tracing code around every HTTP call, AMQP message, database query, or framework operation, you install instrumentation libraries that handle it for you. Each protocol and library has its own instrumentation package that knows how to extract and propagate trace context. You add a few lines of setup code and get comprehensive traces across all your communication channels.
In practice, there’s a catch. Understanding it requires looking at how auto-instrumentation actually works.
How Auto-Instrumentation Works
OpenTelemetry’s auto-instrumentation is surprisingly hands-off. Install a few packages, add some initialization code, and your application emits traces for HTTP requests, database queries, and framework-specific operations. No changes to your business logic required.
But what’s actually happening under the hood? Well, how auto-instrumentation works depends on the language and runtime:
- Java has agents that modify bytecode at class load time.
- Go requires compile-time instrumentation since there’s no runtime reflection.
- Python and Node.js use monkey-patching.
Behind the Curtain: Monkey-Patching in Node.js
When NestJS-specific spans were missing from my traces (more on what I tried in the experiments section below), I dug into how auto-instrumentation actually works in Node.js: Monkey-patching, a technique where code intercepts and wraps existing functions at runtime. When you initialize OpenTelemetry with the NestJS instrumentation, it doesn’t scan your code or use decorators. Instead, it hooks into Node.js’s module loading system.
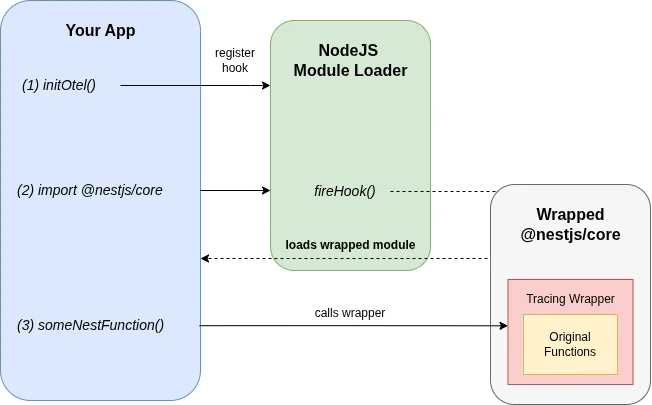
Here’s the simplified flow:
- Register a hook: OpenTelemetry registers a callback with Node’s module loader that triggers whenever a module is
require()’d orimport’ed - Intercept the target: When
@nestjs/coreloads, the hook fires - Wrap the functions: OpenTelemetry replaces key functions (like route handlers) with wrapped versions that start spans, record metadata, and call the original function
- Return the patched module: Your application receives the instrumented version without knowing the difference
This is why OpenTelemetry’s instrumentation libraries are named things like @opentelemetry/instrumentation-nestjs-core. Each of those libraries knows how to patch a specific module.
The Loading Order Problem
There’s a fundamental constraint: the hook must be registered before the target module loads. If @nestjs/core is already in memory when OpenTelemetry initializes, there’s nothing to intercept. The module loaded without patches, and adding them retroactively isn’t possible.
This is why you’ll see this warning when things go wrong:
Module @nestjs/core has been loaded before @opentelemetry/instrumentation-nestjs-coreso it might not work, please initialize it before requiring @nestjs/core.In a simple Node.js application, this is easy to solve. Import your instrumentation setup before anything else:
import './instrumentation'; // Sets up OpenTelemetryimport { NestFactory } from '@nestjs/core'; // Now this gets patchedBut this falls apart when bundlers enter the picture.
How Bundlers Break the Assumption
Bundlers like esbuild, webpack, and rollup analyze your code statically and produce an optimized output. They don’t preserve the runtime loading semantics you might expect from your import order.
When esbuild processes this:
import './instrumentation';import { NestFactory } from '@nestjs/core';It sees two imports with no runtime dependency between them. The bundler may:
- Hoist all imports to the top of the bundle
- Reorder initialization based on the dependency graph
- Inline modules in an order optimized for bundle size, not execution sequence
The result in our case: @nestjs/core initializes before your instrumentation code runs, even though your source files suggest otherwise.
Your source code ✓
// (1) First, the instrumentationimport './instrumentation';
// (2) Second, load NestJSimport { NestFactory } from '@nestjs/core';
// Looks good, right?
Bundled output ✗
// (1) Define instrumentation methodvar init_src = esm({  'libs/instrumentation/src/index.ts'() {    // ...  },});
// (2) Load NestJSimport { NestFactory } from '@nestjs/core';
// (3) Run the instrumentation// (patching too late!)init_src();
The init_src() call (your instrumentation) executes after NestJS modules are already in memory. There’s nothing left to patch.
I ran into this exact issue in a NestJS monorepo using Nx and esbuild. Traces appeared for some things (like outgoing HTTP calls) but NestJS-specific spans were missing entirely.
Experiments: What Doesn’t Work
I set up a minimal reproduction repository to test different approaches.
Importing instrumentation first: Doesn’t help. The bundler reorders things anyway.
Using esbuild’s inject option: This prepends files to the bundle, but the module initialization order inside the bundle still doesn’t guarantee instrumentation runs first.
Dynamic imports: You could dynamically import NestJS after initializing instrumentation, but this is awkward and doesn’t play well with TypeScript and bundler optimizations.
The Fix: Escape the Bundle
The solution is to load instrumentation outside the bundle’s module system entirely.
Node.js has a --require flag (or --import for ESM) that loads a module before the entry point executes. This happens at the Node.js level, before your bundled code even starts:
node --require ./instrumentation.js ./dist/main.jsBy the time your bundled application begins initializing, OpenTelemetry’s hooks are already registered. Every require() and import inside the bundle passes through those hooks.
In an Nx monorepo, you configure this in the project’s serve target:
{ "serve": { "executor": "@nx/js:node", "options": { "runtimeArgs": ["--require", "./dist/apps/myapp/instrumentation.js"] } }}The instrumentation file is built as a separate entry point (not bundled into your main application), and Node loads it first.
Sharing Instrumentation Configuration
Once you have multiple services, you’ll want to share instrumentation configuration between them. Duplicating the OpenTelemetry setup in every service leads to the usual problems: inconsistent configurations, repeated boilerplate, and painful updates when you need to change exporters or add new instrumentations.
The goal is to centralize the setup logic while still allowing each service to specify its own identity (service name, environment, etc.). The trick is separating what gets configured from when it runs.
The pattern:
- A shared library contains the OpenTelemetry SDK setup, exporter configuration, and list of instrumentations
- Each service has a small entry point that imports the shared library and passes service-specific config
- That entry point is loaded via
--requirebefore the main application
Example with Nx:
In an Nx monorepo, you’d create a shared library:
export function startTracingSDK(config: { serviceName: string; endpoint: string }) { // OpenTelemetry SDK setup, exporters, instrumentations...}Each application gets its own instrumentation entry point:
import { startTracingSDK } from '@myorg/instrumentation';
startTracingSDK({  serviceName: 'myapp',  endpoint: process.env.OTEL_RECEIVER_ENDPOINT,});
The Nx project configuration builds this as a separate entry point and loads it via --require:
{ "build": { "options": { "additionalEntryPoints": ["apps/myapp/src/instrumentation.ts"] } }, "serve": { "options": { "runtimeArgs": ["--require", "./dist/apps/myapp/instrumentation.js"] } }}This way, adding a new instrumentation library or changing the exporter endpoint happens in one place, and all services pick it up.
What About Performance?
A reasonable question: if auto-instrumentation wraps all these functions at runtime, what’s the performance cost?
At FOSDEM 2025, James Belchamber presented “The Performance Impact of Auto-Instrumentation”, examining exactly this question. Auto-instrumentation isn’t free; it adds overhead proportional to your application’s scale. But the talk reinforced something I’d suspected: for most applications, the tracing data you get is worth the overhead.
Consider the alternative: manually instrumenting every HTTP handler, database call, and framework operation. You’d write more code, maintain more code, and likely miss edge cases that the instrumentation libraries handle correctly. Auto-instrumentation gives you comprehensive coverage with minimal effort. That’s a good trade-off.
Start with auto-instrumentation, let performance become a problem first. If profiling later reveals it’s a bottleneck (unlikely for most workloads), you can selectively disable specific instrumentations or switch to manual spans for hot paths. But don’t prematurely optimize away the observability that helps you find actual performance problems.
Key Takeaways
Auto-instrumentation in NodeJS is monkey-patching. It hooks into module loading to wrap functions with tracing logic.
Timing is important. The hooks must register before target modules load. Miss that window, and there’s nothing to patch.
Bundlers break the mental model. Your import order doesn’t guarantee execution order in the output. Bundlers optimize for different goals.
Node’s --require flag sidesteps the problem. Loading instrumentation at the Node.js level, before the bundle executes, guarantees the hooks are in place.
Understanding these mechanics makes debugging instrumentation issues much easier. When traces are missing, the question is always: did the instrumentation initialize before the target module?
Resources:
- My Experiment Repository: https://github.com/georg-schwarz/nestjs-instrumentation-example
- OpenTelemetry JS Documentation: https://opentelemetry.io/docs/languages/js/