Monitoring DNS Issues in Kubernetes with Node Problem Detector
TL;DR
- Problem: Some nodes lost DNS connectivity at random, leading to failing container pulls and broken inter-node communication
- Root cause: Unknown. Restarting the affected node fixes it.
- Solution: Node Problem Detector (NPD) with custom DNS health checks to monitor DNS failure
- Outcome: Alerting automation for failing DNS, enabling follow-up investigations and manual intervention
🔗 Node Problem Detector on GitHub | Helm Chart on GitHub
The Problem: Silent DNS Failures
I’ve been running two bare-metal Kubernetes clusters (development and production) for a university project. Each cluster has 10-15 nodes, and we’ve invested significant effort into making the infrastructure reliable: three-node control plane HA, automated provisioning with Ansible, comprehensive monitoring with Prometheus and Grafana.
But we hit a frustrating problem: nodes would randomly lose DNS connectivity.
The symptoms were subtle at first:
- Container image pulls would fail with timeout errors
- Pods couldn’t resolve service names
- Inter-node communication would break sporadically
The pattern was always the same: a single node would lose the ability to resolve DNS queries (both cluster-internal via CoreDNS and external domains). Restarting the node fixed it immediately, but we had no visibility into when it happened. Often, we’d only notice after a deployment failed or a user reported issues.
The specific challenges:
- Intermittent failures: Not all nodes, not predictable timing
- Hard to detect: Kubernetes control plane remained healthy, only workloads on the affected node failed
- Manual intervention required: Once detected, a node restart fixed it, but detection was the bottleneck
- Unknown root cause: We haven’t identified why this happens (investigating further), but we needed monitoring regardless
We needed a solution that would alert us immediately when a node loses DNS connectivity, so we could investigate the root cause or at least restart the node before it impacts users.
What is Node Problem Detector?
Node Problem Detector (NPD) is a Kubernetes addon that monitors node health and reports problems as node conditions and events.
Think of it as a health check daemon for your cluster nodes. It runs on every node (via DaemonSet) and continuously monitors various aspects of node health: kernel issues, Docker daemon problems, hardware failures, and custom checks you define.
How it works:
- Monitoring: NPD runs different types of monitors (system log monitors, system stats monitors, custom plugin monitors)
- Detection: When a monitor detects a problem, it reports it to Kubernetes
- Reporting: Problems are exposed as:
- Node Conditions: Show up in
kubectl describe nodeunder the Conditions section - Node Events: Visible in
kubectl get events - Metrics: Can be scraped by Prometheus for alerting
- Node Conditions: Show up in
Why NPD for DNS monitoring?
DNS failures aren’t visible to the Kubernetes control plane. From the kubelet’s perspective, everything is fine. CoreDNS pods might be healthy, but if a specific node can’t reach them or resolve queries, workloads on that node silently fail.
NPD fills this gap by running custom health checks and surfacing failures as Kubernetes-native signals that your monitoring system can alert on.
The Custom Plugin System
NPD supports several monitor types, but for DNS checking, we need custom plugin monitors. These let you define arbitrary health checks using shell scripts.
Anatomy of a custom plugin monitor:
A custom plugin consists of two parts:
- Monitor configuration (JSON): Defines when to run the check, what constitutes a problem, and how to report it
- Health check script (shell): The actual logic that tests for the problem
NPD runs your script at regular intervals. Based on the exit code (0 = healthy, non-zero = problem), NPD updates the node’s condition status.
Implementation Walkthrough
Let’s walk through deploying Node Problem Detector with custom DNS health checks. I’ll cover both the configuration and the operational aspects.
Step 1: Understanding What to Monitor
For our DNS issue, I needed to monitor two things:
- Internal cluster DNS: Can the node’s pods resolve Kubernetes service names? (e.g.,
kubernetes.default.svc.cluster.local) - External DNS: Can the node’s pods resolve external domains? (e.g.,
google.com)
Important insight: Since NPD runs as a pod on each node, the DNS checks are performed from within the pod using the cluster’s DNS configuration (CoreDNS). This means we’re actually testing whether CoreDNS is reachable and functioning from the node’s perspective, which serves as a proxy for detecting the underlying node DNS issues.
Why monitor both internal and external resolution? Because the failure mode matters for troubleshooting:
- If only internal DNS fails, it might be a CoreDNS configuration issue
- If only external DNS fails, it might be an upstream resolver or CoreDNS forwarding issue
- If both fail, it’s likely CoreDNS is unreachable from the node (indicating the node-level networking problem we’re trying to detect)
Step 2: Deploying Node Problem Detector via Helm
NPD has an official Helm chart maintained by DeliveryHero. I created a custom helm chart, using the official chart as dependency and track its version (rather than using a one-time helm install command):
---apiVersion: v2name: node-problem-detectordescription: A Helm chart for deploying node-problem-detector to detect and report node problemstype: applicationversion: 0.1.0appVersion: 'v0.8.19'
dependencies:  - name: node-problem-detector    version: '2.3.14'    repository: 'https://charts.deliveryhero.io/'
This approach (wrapping the upstream chart as a dependency) lets me version-control my custom configuration separately from the upstream chart.
---# Configuration one level deeper as node-problem-detector is specified as Helm dependencynode-problem-detector: metrics: enabled: true serviceMonitor: enabled: trueNote the structure: the chart is a dependency, so configuration goes under node-problem-detector: (one level deeper than usual).
As configuration, the default is sensible. I just enabled the ServiceMonitor for later monitoring metrics via Prometheus if needed. Depending on your Prometheus configuration (for me, it just uses all ServiceMonitors per default independent of the namespace) you might need to add further configuration.
Step 3: Configuring Custom DNS Checks
Here’s where it gets interesting. NPD’s Helm chart lets you define custom monitors inline in the values file.
values.yaml structure:
---node-problem-detector:  { ... metrics config ... }
  settings:    custom_plugin_monitors:      - /custom-config/dns-monitor.json
    custom_monitor_definitions:      dns-monitor.json: |        { ... monitor config ... }      check_dns.sh: |        ... health check script ...
Step 3.1: Writing the DNS Monitor Configuration
Let’s break down the DNS monitor configuration:
{ "plugin": "custom", "pluginConfig": { "invoke_interval": "60s", "timeout": "15s", "max_output_length": 80, "concurrency": 1 }, "source": "dns-monitor", "metricsReporting": true, "conditions": [ { "type": "DNSProblem", "reason": "DNSIsWorking", "message": "DNS resolution is working" } ], "rules": [ { "type": "temporary", "reason": "DNSResolutionFailed", "path": "/custom-config/check_dns.sh", "timeout": "12s" }, { "type": "permanent", "condition": "DNSProblem", "reason": "DNSResolutionFailed", "path": "/custom-config/check_dns.sh", "timeout": "12s" } ]}Configuration breakdown:
- invoke_interval: ”60s”: Run the check every 60 seconds
- timeout: ”15s”: Kill the script if it hangs (needs to be longer than the script’s internal retry logic)
- conditions: Define the node condition that will appear in
kubectl describe node. The condition type isDNSProblem, and when healthy, the reason is “DNSIsWorking” - rules: Define when to trigger the condition
- temporary rule: If the script fails once, mark it as a temporary issue (transient failure)
- permanent rule: If the script continues to fail, set the condition to permanent (sustained problem requiring attention)
Step 3.2: Writing the DNS Health Check Script
The health check script tests both internal and external DNS resolution with built-in retry logic to avoid false positives:
#!/bin/bash# Check DNS resolution with retries to avoid false positives
readonly OK=0readonly NONOK=1readonly RETRIES=3readonly RETRY_DELAY=1
# Function to check internal DNS resolutioncheck_internal_dns() {  timeout 2 getent hosts kubernetes.default.svc.cluster.local >/dev/null 2>&1  return $?}
# Function to resolve external domaincheck_external_dns() {  timeout 2 getent hosts google.com >/dev/null 2>&1  return $?}
# Retry logic: fail only if all retries failfor i in $(seq 1 $RETRIES); do  # First check internal DNS resolution  if ! check_internal_dns; then    if [ $i -lt $RETRIES ]; then      sleep $RETRY_DELAY      continue    else      echo "DNS check failed: Cannot resolve internal DNS after $RETRIES attempts"      exit $NONOK    fi  fi
  # Then check external DNS resolution  if ! check_external_dns; then    if [ $i -lt $RETRIES ]; then      sleep $RETRY_DELAY      continue    else      echo "DNS check failed: Cannot resolve external domains after $RETRIES attempts"      exit $NONOK    fi  fi
  # Both checks passed  echo "DNS resolution working"  exit $OKdone
# Should not reach here, but just in caseecho "DNS check failed unexpectedly"exit $NONOK
Script features:
- Combined checks: Tests both internal (
kubernetes.default.svc.cluster.local) and external (google.com) DNS resolution - Retry logic: Attempts each check up to 3 times with 1-second delays to avoid false positives from transient network issues
- Timeouts: Each individual DNS query has a 2-second timeout to prevent hanging
- Clear error messages: Different failure messages for internal vs external DNS failures to aid troubleshooting
Why getent hosts instead of nslookup or dig?
First and foremost, nslookup and dig are not available on the default container that NPD comes with.Further, getent uses the system’s NSS (Name Service Switch) configuration, which mirrors how applications actually resolve DNS. It’s more representative of real-world behavior than querying DNS servers directly.
Why retry logic?
In production Kubernetes environments, occasional transient DNS failures can occur during normal operation (brief network hiccups, CoreDNS pod restarts, etc.). The retry logic ensures we only alert on sustained DNS failures, reducing alert noise.
Step 4: Deploying to the Cluster
With configuration in place, deployment is straightforward:
# Update Helm dependencies (pulls the upstream NPD chart)helm dependency update ./monitoring/node-problem-detector
# Deploy to the clusterhelm upgrade --install node-problem-detector ./monitoring/node-problem-detector \  --namespace monitoring \  --create-namespace \  --wait
NPD deploys as a DaemonSet, so one pod per node. Within a minute or two, all nodes have NPD running.
Step 5: Verifying the Deployment
kubectl get pods -n monitoring -l app.kubernetes.io/name=node-problem-detectorYou should see one pod per node, all in Running state.
kubectl describe node <node-name> | grep -A 15 "Conditions:"You should see a new condition DNSProblem showing False (meaning no problem detected) with reason “DNSIsWorking”.
Conditions: Type Status LastHeartbeatTime LastTransitionTime Reason Message ---- ------ ----------------- ------------------ ------ ------- DNSProblem False Sat, 22 Nov 2025 15:42:46 +0100 Sat, 22 Nov 2025 15:32:44 +0100 DNSIsWorking DNS resolution is working KernelDeadlock False Sat, 22 Nov 2025 15:42:46 +0100 Sat, 22 Nov 2025 15:32:44 +0100 KernelHasNoDeadlock kernel has no deadlock ReadonlyFilesystem False Sat, 22 Nov 2025 15:42:46 +0100 Sat, 22 Nov 2025 15:32:44 +0100 FilesystemIsNotReadOnly Filesystem is not read-only CorruptDockerOverlay2 False Sat, 22 Nov 2025 15:42:46 +0100 Sat, 22 Nov 2025 15:32:44 +0100 NoCorruptDockerOverlay2 docker overlay2 is functioning properly MemoryPressure False Sat, 22 Nov 2025 15:43:32 +0100 Sat, 22 Nov 2025 14:16:13 +0100 KubeletHasSufficientMemory kubelet has sufficient memory available DiskPressure False Sat, 22 Nov 2025 15:43:32 +0100 Sat, 22 Nov 2025 14:16:13 +0100 KubeletHasNoDiskPressure kubelet has no disk pressure PIDPressure False Sat, 22 Nov 2025 15:43:32 +0100 Sat, 22 Nov 2025 14:16:13 +0100 KubeletHasSufficientPID kubelet has sufficient PID available Ready True Sat, 22 Nov 2025 15:43:32 +0100 Sat, 22 Nov 2025 14:16:13 +0100 KubeletReady kubelet is posting ready statusCheck NPD metrics:
NPD exposes Prometheus metrics. If you have a ServiceMonitor configured (we enabled it in the values), Prometheus will scrape them automatically:
kubectl get servicemonitor -n monitoring node-problem-detectorQuery Prometheus for problem_gauge metrics to verify the DNS checks are working and to alert on failures:
problem_gauge{type="DNSProblem", reason="DNSResolutionFailed"}This metric is 1 when DNS resolution is failing and 0 when healthy. Here’s an example Grafana dashboard showing the query in action:
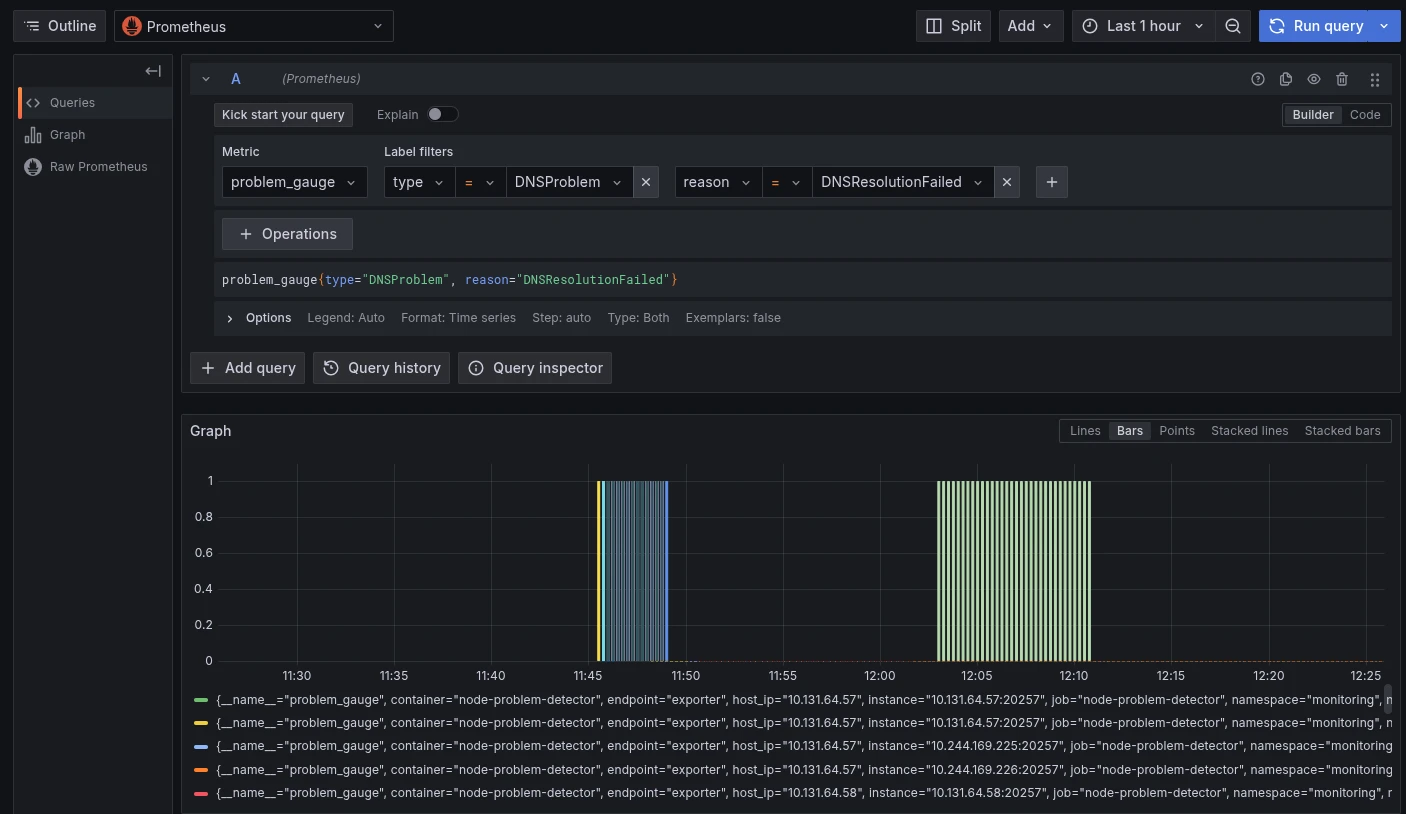
Step 6: Setting Up Alerting
Now that NPD is reporting DNS health as node conditions, we can alert on failures using kube-state-metrics.
If you run kube-state-metrics (standard in most Prometheus setups), it exposes node conditions as metrics:
kube_node_status_condition{condition="DNSProblem", status="true"} == 1Create a PrometheusRule to alert when this metric is non-zero:
apiVersion: monitoring.coreos.com/v1kind: PrometheusRulemetadata: name: node-dns-alerts namespace: monitoringspec: groups: - name: node-dns interval: 30s rules: - alert: DNSDown expr: kube_node_status_condition{condition="DNSProblem", status="true"} == 1 for: 2m labels: severity: critical annotations: summary: 'Node {{ $labels.node }} has DNS resolution problems' description: 'Node {{ $labels.node }} cannot resolve DNS names (both internal and external checks failed).'Configuring alert destinations:
Wire Prometheus Alertmanager to send notifications to your preferred channel (email, Slack, PagerDuty, etc.). In our case, we configured email alerts so we get notified immediately when a node loses DNS.
Operational Experience
What Happens When DNS Fails?
When a node loses DNS connectivity:
- NPD’s custom plugin detects the failure (within 60 seconds, based on our check interval, plus retry logic)
- NPD sets the node condition
DNSProblemtoTrue - kube-state-metrics picks up the condition change
- Prometheus evaluates the alert rule
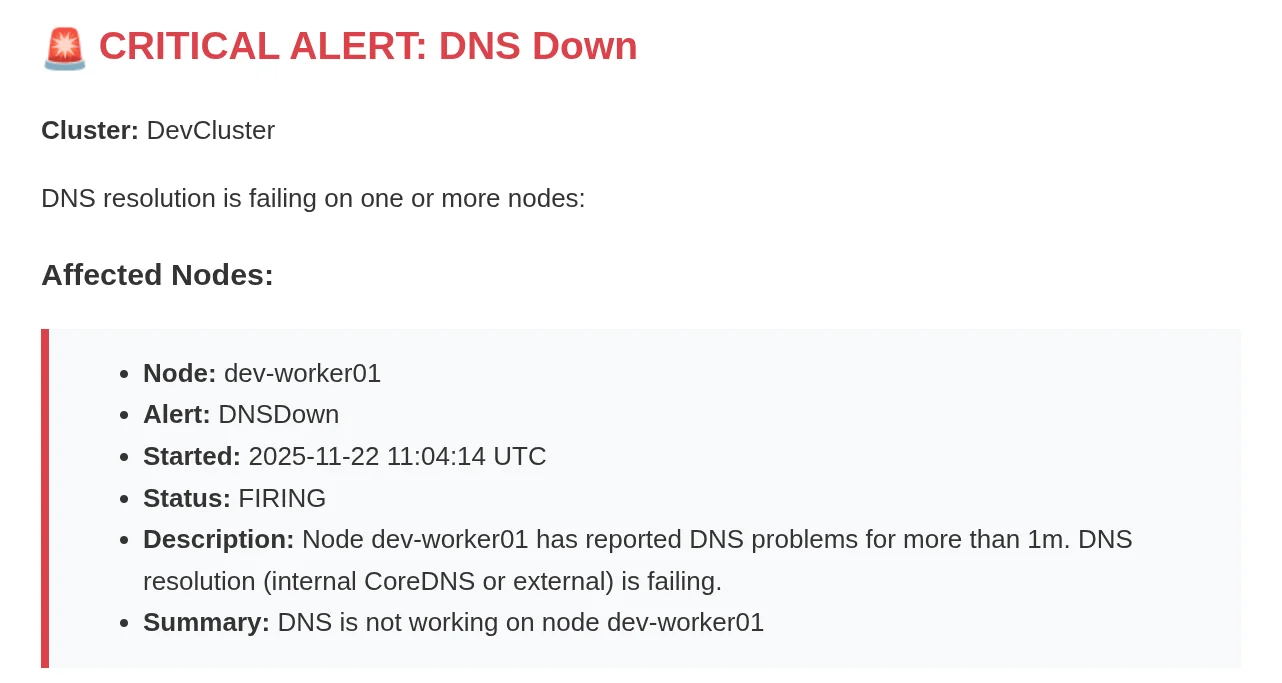
- After the
for: 2mthreshold, Alertmanager fires the alert - We receive an email: “Node worker-01 has DNS resolution problems”:
Response workflow:
- Check Grafana dashboards to see if other nodes are affected (usually just one node)
- SSH to the affected nod and pod and verify DNS failure manually
- Investigate logs for clues (still trying to identify root cause)
- Restart the node to restore DNS functionality
- Monitor to ensure the node recovers
Troubleshooting Tips
NPD pod logs:
If checks aren’t running as expected, check the NPD pod logs:
kubectl logs -n monitoring -l app.kubernetes.io/name=node-problem-detector --tail=100Look for errors like:
- “Failed to execute custom plugin” or “Script timeout”
- “Failed to read configuration file” (missing JSON config)
- “No create function found for plugin” (wrong monitor type in log_monitors list)
Testing the check scripts manually:
SSH to a node and run the check script manually to verify it works:
# Find the NPD pod on this nodekubectl get pods -n monitoring -o wide | grep $(hostname)
# Exec into the podkubectl exec -it -n monitoring <pod-name> -- /bin/sh
# Run the check script/custom-config/check_dns.shecho $?  # Should be 0 if DNS is working
Conclusion
Node Problem Detector supports useful monitors like KernelDeadlock out of the box, but allows for extension, e.g., DNS monitors in our case. By defining custom health checks that run continuously on every node, we now detect failures within minutes instead of hours.
The implementation was straightforward: a Helm chart, one JSON config, and one shell script with retry logic. The operational benefit is substantial: we can investigate issues while they’re happening, and we can manually restart nodes before users are impacted until we find the root cause.
Key takeaways:
- NPD is Kubernetes-native monitoring for node-level problems that the control plane can’t see
- Custom plugin monitors are flexible and let you check anything scriptable
- Alerting on node conditions closes the loop between detection and response
- Automation is the next step, but visibility comes first
If you’re running production Kubernetes and troubleshooting node-level issues, Node Problem Detector is worth exploring. The custom plugin system makes it adaptable to any cluster-specific problem you need to monitor.
Resources:
- Node Problem Detector GitHub: https://github.com/kubernetes/node-problem-detector
- NPD Helm Chart: https://github.com/deliveryhero/helm-charts/tree/master/stable/node-problem-detector
- Custom Plugin Documentation: https://github.com/kubernetes/node-problem-detector/blob/master/docs/custom_plugin_monitor.md
This article documents a real implementation of Node Problem Detector for monitoring DNS health in a production Kubernetes cluster, showing how custom health checks can detect issues invisible to the Kubernetes control plane.